REImu Watch
June 2021
Context
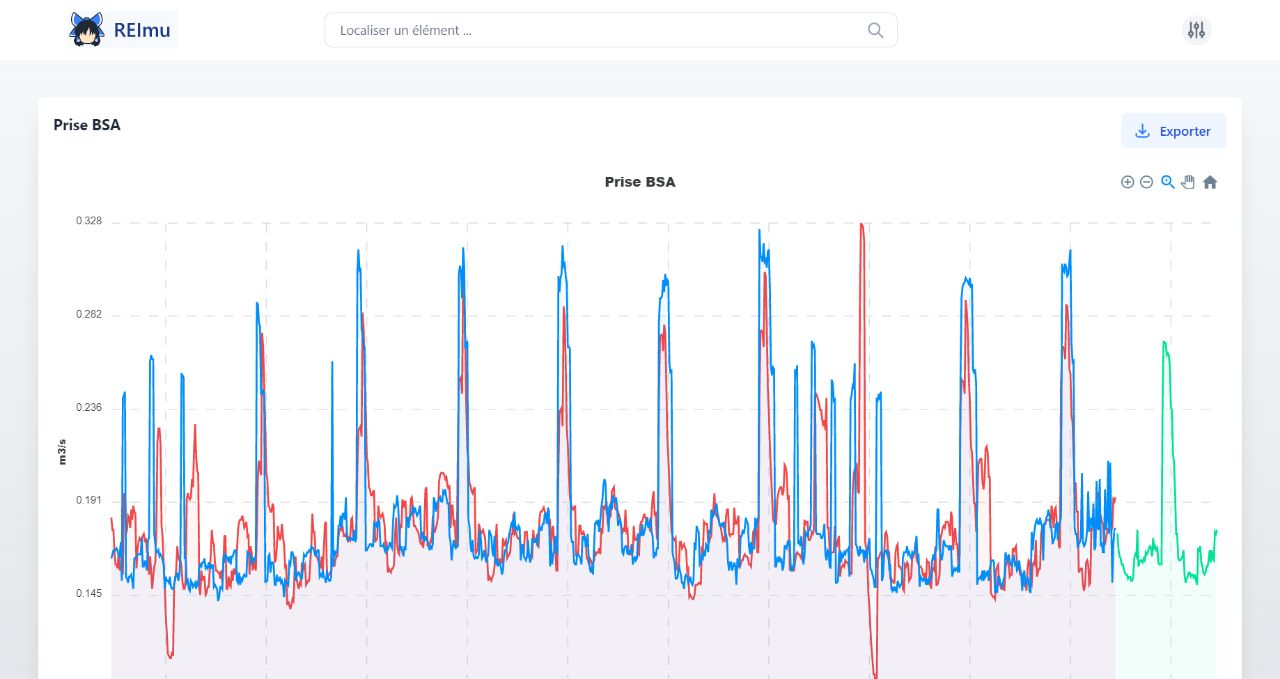
REImu was an IoT project to apply Machine Leaning models to sensor data. I worked with the data outputted form the ML model to create visualisations on a simple dashboard.
Realisation
Using SvelteJS and TailwindCSS for the front-end, I had a simple python script that got called on-demand that regenerated the database with last values.
The charts are made with Apex Charts and got integrated with SvelteJS thanks to data binding.
To keep itself updated, the webpage would periodically fetch the database and looking at the HTTP result code would know if the data where changed. The SvelteJS reactive process worked pretty well, and I didn’t have to think much on how to update the document.
Finally, I wrote an “Export” button to quickly get the data on Excel or any other tool.
Dashboard in action
You can get a Page Screenshot from late June on how the page looked like (no Javascript, just global design)
Also Read
-
-
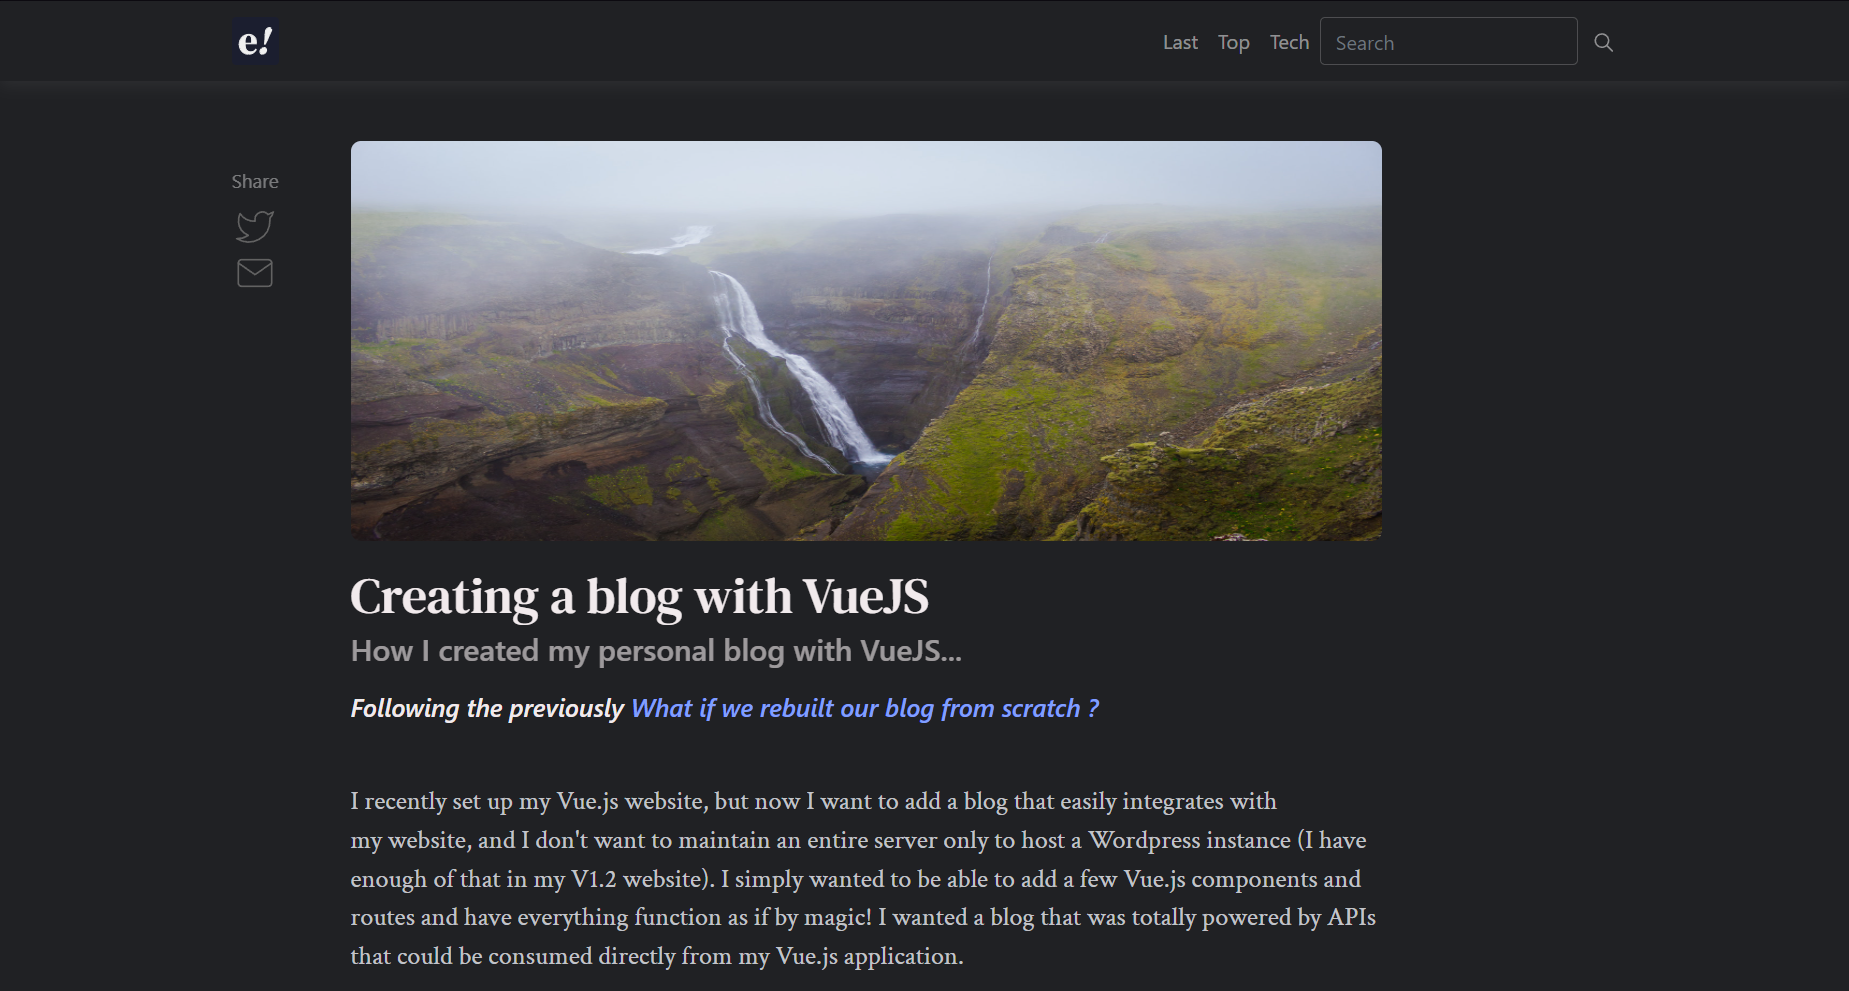
Headless personal Blog
Misete
Building my (old) personal blog with VueJS 2 as an headless blog that fetch data from Symfony API
-
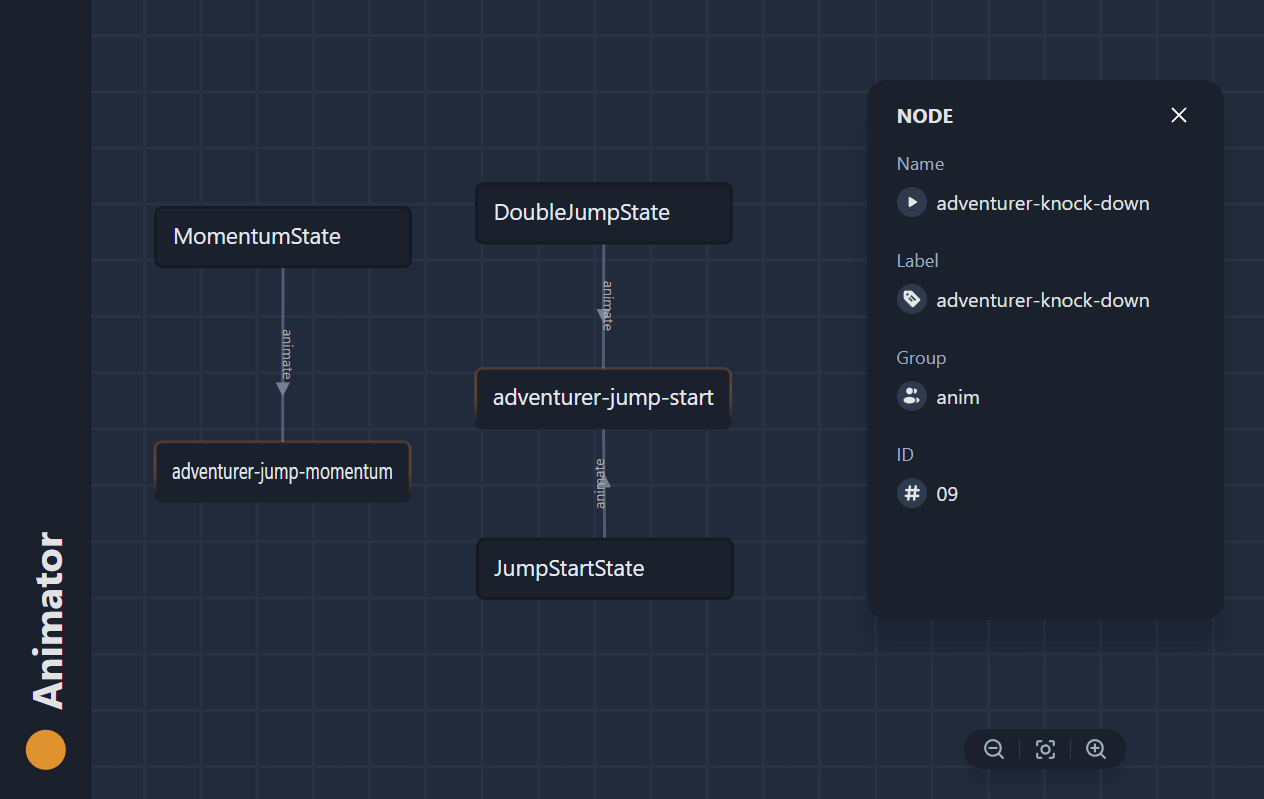
Graph Viewer
Animator Graph Viewer
Visualize class relationships and animations with a d3.js-based interface using Vite and Svelte. Class parsing done with Node script.